
What is Business Intelligence Software?
 Such tools enable users, not just elite analysts, to amass data-driven knowledge. An important character in the extant panorama of BI is so-called such tools enable users, not just elite analysts, to amass data-driven knowledge. Such tools enable users, not just elite analysts, to amass data-driven knowledge; they’re not just single-point solutions that aggregate data all over the place – such as a person’s credit rating or airline seats for sale – but that track all your data in a single source.
In this way, you have what you need: the insights you require, all in one place (no toggling between products), and data visualization and access to multiple data sources are easier. There are quite many companies offering BI services, if you look at catalogs like goodfirms, so BI and BigData services are in demand.
All BI tools enable you to manipulate data sources to generate actionable insights on specific elements that are most critical for the progress of the business. Consume tailor-made reports and drill down into the metrics that can effectively influence the performance of that particular business with these intelligent tools.
Such tools enable users, not just elite analysts, to amass data-driven knowledge. An important character in the extant panorama of BI is so-called such tools enable users, not just elite analysts, to amass data-driven knowledge. Such tools enable users, not just elite analysts, to amass data-driven knowledge; they’re not just single-point solutions that aggregate data all over the place – such as a person’s credit rating or airline seats for sale – but that track all your data in a single source.
In this way, you have what you need: the insights you require, all in one place (no toggling between products), and data visualization and access to multiple data sources are easier. There are quite many companies offering BI services, if you look at catalogs like goodfirms, so BI and BigData services are in demand.
All BI tools enable you to manipulate data sources to generate actionable insights on specific elements that are most critical for the progress of the business. Consume tailor-made reports and drill down into the metrics that can effectively influence the performance of that particular business with these intelligent tools.What Should You Look for in Business Intelligence Software?
Business intelligence tools have gained great popularity in recent years, but there are many different versions and not all offer the same advantages. ?️ Read the input again with the suggested response highlighted. Here’s what to look for in BI tools:- Intuitive interactive dashboards: Present numbers and data in a simple way that garners buy-in from key decision-makers by customizing dashboards and data visualization.
- Built-in AI: Natural Language Processing and text-analysis for your thoughts – more layers of insight and angles to look at data.
- Integrations: For optimized workflows, the best BI tools need to work with other data platforms and applications for improved data flow.
- Capability in data mining: That is, software able to work on multiple data sets using different, and sophisticated, analytics tools.
- Smart notifications: Alerts for good and bad data points so reports don’t have skewed findings.
The 11 Best Business Intelligence Software to Use in 2025
Get your business intelligence methods in order with these 10 best business intelligence software. Teeming with ETL engine, data warehouse, and data visualization tools, they bring a host of business intelligence solutions for companies investing their company data into analysis. And for each one, we’ve included an overview of notable features, potential drawbacks, pricing, and rating information to help you determine which is the best shopping cart for your business. ✨1. SAP BusinessObjects Business Intelligence
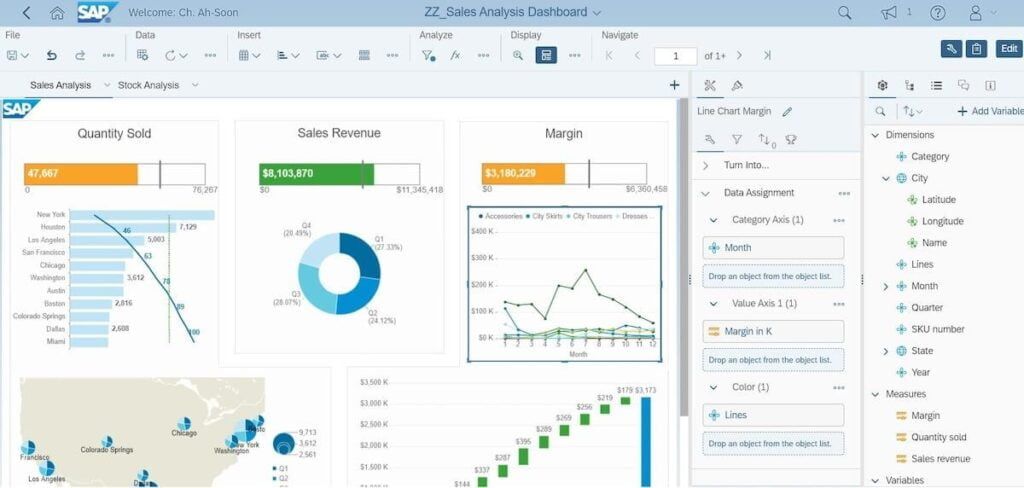 via SAP BusinessObjects
SAP BusinessObjects Business Intelligence best features
- With real-time data, you can see what’s happening in the moment, have advanced analytics on the metrics that matter to your business, and so on.
- Reporting doesn’t stop at features like reporting by number; it also goes to the root causes and to ad hoc queries to get today’s answers or the answers to yesterday’s questions fast (even when analyzing multiple data sources at the same time).
- With the advent of self-service business intelligence capabilities and data visualization tools, data no longer dominates you. You empower it. You brand it. That’s how it looks to you.
- Insights gained using permissioned sharing lend themselves more easily to internal discussions between departments, or among the teams and sub-teams within an organization.
SAP BusinessObjects Business Intelligence limitations
- While pricing is customized, it tends to be on the higher-end.
- Some users wished integrations were smoother and more seamless.
- G2: N/A
- Capterra: 4.3/5 (200+ reviews)
2. Microsoft Power BI
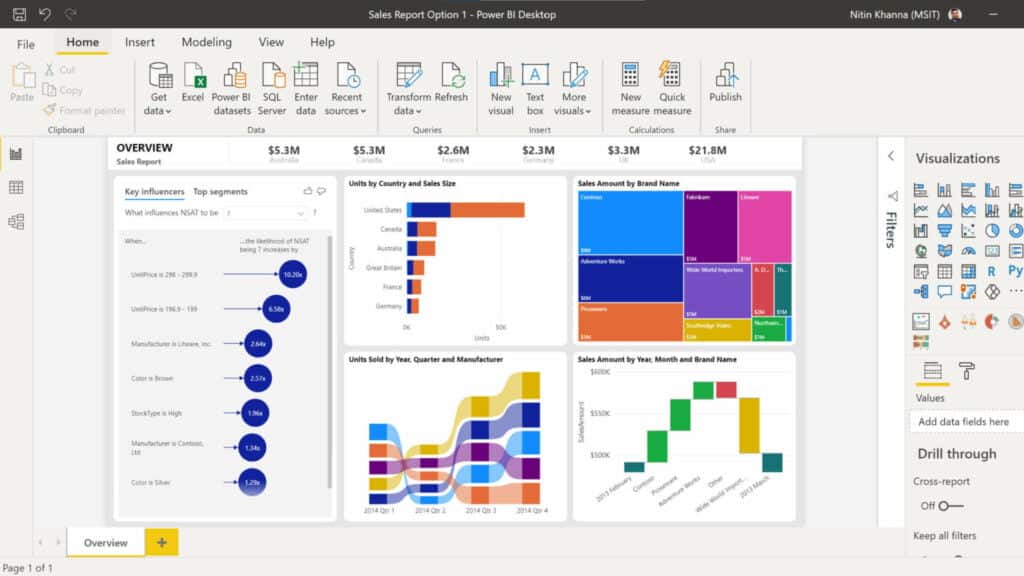 via Power BI
Microsoft Power BI best features
- Features that come pre-built into AI can answer questions, draft reports, and point out where there are spikes in data so that it can be analyzed more quickly.
- Share and embed reports in Excel Spreadsheets and PowerPoint on Teams.
- Microsoft governance, security, and compliance features protect your data and offer end-to-end visibility.
- Free training means the entire team can learn what it does and start digging into the numbers.
Microsoft Power BI limitations
- Some users found the tool struggles with complex or extremely large data sets.
- It’s not an on-premise solution since it’s a cloud-based tool.
- Power BI in Microsoft Fabric: Free
- Power BI Pro: $10/month per user
- Power BI Premium: $20/month per user
- G2: 4.5/5 (1,000+ reviews)
- Capterra: 4.6/5 (1,500+ reviews)
3. Zoho Analytics
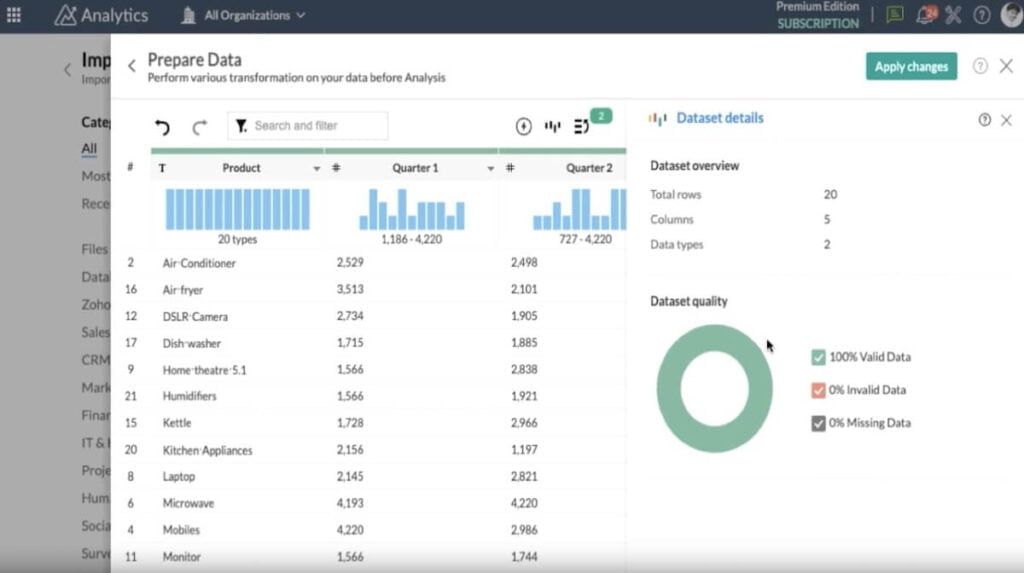 via Zoho
Zoho is the technology company behind a suite of software such as CRM [Customer Relationship Management], process automation, IT products and more (including Zoho Analytics – which ‘unearth real-time insights from connected data’). Visualise results and create sharable reports with tools that can be customised for any team. ?
Zoho Analytics best features
- Link raw data with a large list of integrations, business apps, and various files and data sources, combining them with its own set of business intelligence tools.
- Tweak reports and clean up and catalogue data using self-service data prep.
- Add foresight based on machine learning that interpolates and generates future data, along with ‘what-if’ analytics.
- Embed analytics without needing SQL support, thanks to no-code and low-code models.
Zoho Analytics limitations
- Some users found that data synchronization took several hours to complete.
- Not all reports include activity logs, which can be limited for auditing purposes.
Zoho Analytics pricing
| Plan | Price (billed annually) |
|---|---|
| Basic | $24/month |
| Standard | $48/month |
| Premium | $115/month |
| Enterprise | $455/month |
| Custom | Contact for pricing |
Zoho Analytics ratings and reviews
- G2: 4.2/5 (200+ reviews)
- Capterra: 4.4/5 (200+ reviews)
4. Tableau
 via Tableau
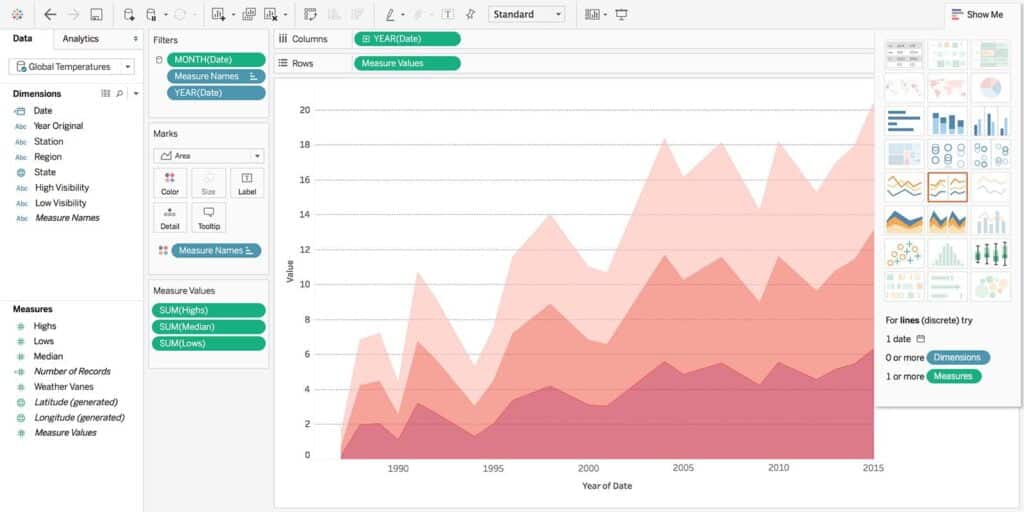
Tableau from Salesforce allows you to visualise analytics with visualisations and pre-built reports, while also having a wide selection of AI-enabled products. When it comes to business intelligence tools, Tableau stands in through its ability to take information such as big data and KPIs, transformed into reports and insights, in order to create actionable steps forward. Why not pick one of dozens of products, ranging from data management to embedded analytics to CRM analytics, to help you gather the kind of information you need to make business decisions?
Tableau best features
- Data visualizations are more powerful than other tools with a high degree of customization.
- Not only can you drag-and-drop to pull in the data points you actually want visible, but built-in guardrails keep you from making common data-visualization missteps – in other words, not following best practice.
- It will have a shorter learning curve and is easier to get up to speed on for business analysis.
- Photo by Martin Meissner/APOne thing it’s great for: collecting and analysing huge and disparate data sets, even if you have a business that relies on a bajillion metrics. Tableau and similar software can isolate data down to the finest level, and then surface patterns or trends.
Tableau limitations
- Some users wish there was more customization when it comes to formatting.
- It’s a more expensive service and you pay by the viewer.
Tableau pricing
| Plan | Price per month |
|---|---|
| Creator | $75/user |
| Explorer | $42/user |
| Viewer | $15/user |
Tableau ratings and reviews
- G2: 4.4/5 (1,900+ reviews)
- Capterra: 4.5/5 (2,000+ reviews)
5. Oracle Business Intelligence
 via Oracle
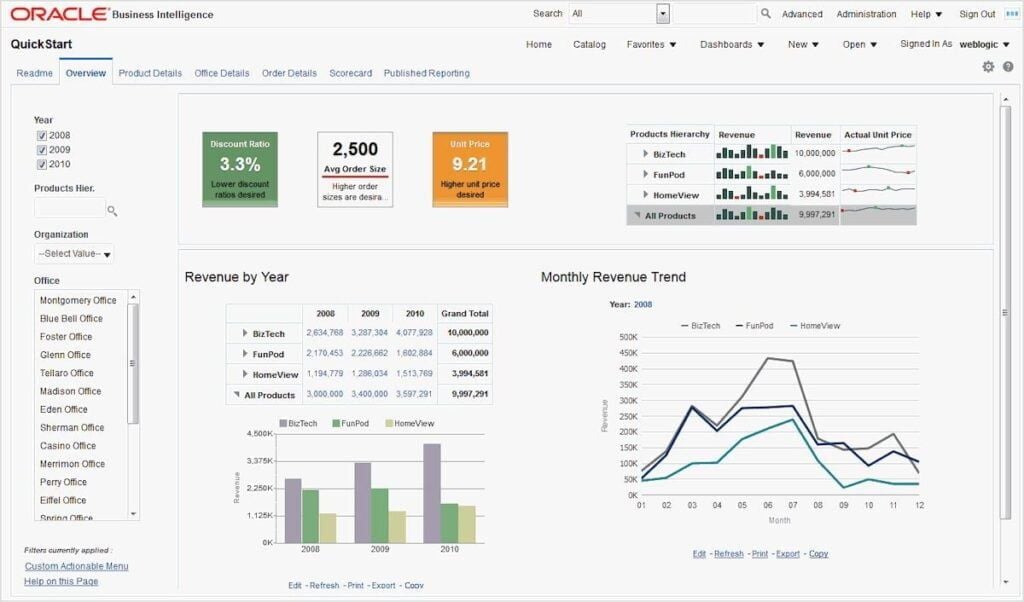
Oracle BI best features
- Connection to web-based applications such as J2EE or .NET affords more powerful data integration and access to large data sources.
- Oracle BI Answers lets you easily create charts, pivot tables, and dashboards with data modeling and interactive visual analytics.
- BI Delivers delivers personalized data-based data notifications and alerts in real time so you can optimize your workflow.
- The publisher tool, for example, enables businesses and professionals to share important data with investors, stakeholders, corporate clients or internal teams and staff.
Oracle BI limitations
- System requirements, including memory and disk space, can be limiting.
- Limited dashboard customization compared to other business intelligence tools.
Oracle BI pricing
Contact sales for pricingOracle BI ratings and reviews
- G2: 3.3/5 (10+ reviews)
- Capterra: 4.1/5 (80+ reviews)
6. Qlik Sense
 via Qlik Sense
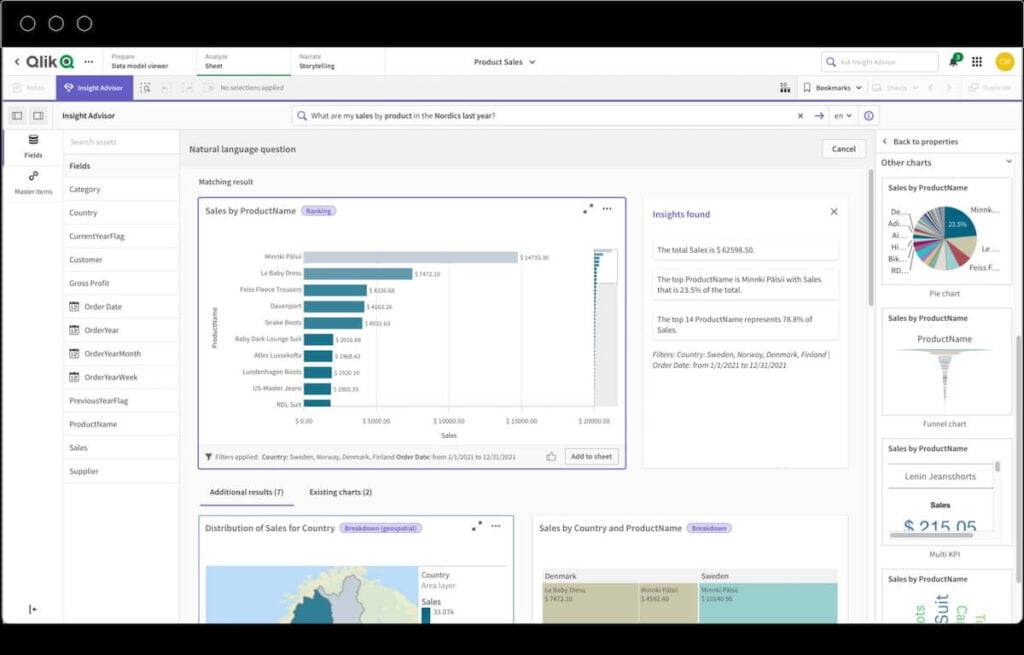
Qlik Sense best features
- Integrate with OLAP, BEx, ETL and query tools even deeper using one of several SAP Connectors.
- Thanks to Data Warehouse Automation, business data is constantly scraped for new data sources, models are continuously refined, and a trusted data catalog is produced.
- Alertings and actions, on the other hand, are for creating notifications and tasks to take action on insights detected by data.
- The single SaaS mashup provides a hybrid cloud user interface – with more secure controls over sharing and storage than cloud computing.
Qlik Sense limitations
- Large data analysis and data sets can slow down the tool.
- Some add-ons and plugins have additional costs which are the enlarging factor for the process of pricing the plan. Pricing of plans are high which most of the smaller budgets are hard to afford personally due to the any new site is not free but hard to invest hard work and money in any new business.
Qlik Sense pricing
| Plan | Price per month per user |
|---|---|
| Standard | $20 |
| Premium | $2,700 |
| Enterprise | Contact for pricing |
Qlik Sense ratings and reviews
- G2: 4.5/5 (600+ reviews)
- Capterra: 4.4/5 (200+ reviews)
7. Yellowfin BI
 via Yellowfin BI
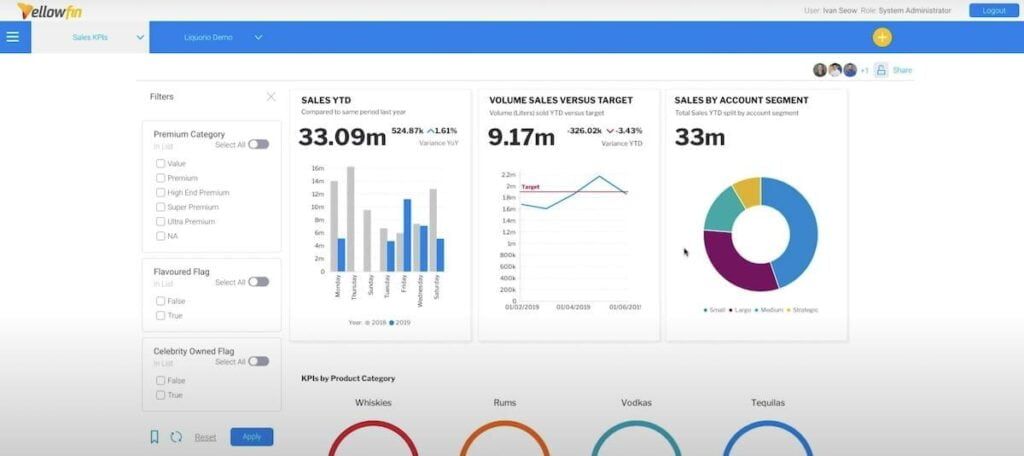
So you can visualise data, with stunning dashboards, and you can pick the tool that has self-service analytics or AI-backed analytics – this is what Yellowfin BI offers. This tool is not just a pure technological solution, it’s built with the non-technical user in mind.
Yellowfin BI best features
- Built-in operational workflows facilitate the creation of actions linked to business data and reporting.
- Set triggers and create alerts when a threshold is crossed or use AI insights to visualise your business and trigger notifications on critical signals.
- Drag-and-drop data visualizations cut down the time it takes to create engaging reports.
- Select from a library of report builder widgets and charts so everyone on the team can create dashboards and visualise data.
Yellowfin BI limitations
- Data extraction can take time, especially with larger data sets.
- Some integrations could be smoother.
Yellowfin BI pricing
Contact for custom pricing and plansYellowfin BI ratings and reviews
- G2: 4.2/5 (100+ reviews)
- Capterra: 4.6/5 (10+ reviews)
8. Dundas BI
 via Insightsoftware
The visual dashboards of Dundas BI are complemented by integrations and data structure tools that give you higher visibility and more powerful analytics. The premium paid version emphasizes experiences: insights into your data are easy to discuss with others and to import into the key tool you use on a day-to-day basis.
Dundas BI best features
- Data connectivity and integration support make it take less time to switch between tools, giving you insights faster.
- Interactive visualization tools let you control how you see and respond to data.
- A user-friendly interface that is easy to change and self-service support allowing the user to drill down to the data of interest.
- Flexible data warehousing enables greater control over the storage, extraction, and indexing of information.
Dundas BI limitations
- Some users want more data analysis filters when segmenting.
- Large data sets may slow things down and cause glitches.
Dundas BI pricing
Contact for pricingDundas BI ratings and reviews
- G2: N/A
- Capterra: N/A
9. Datapine
 via Datapine
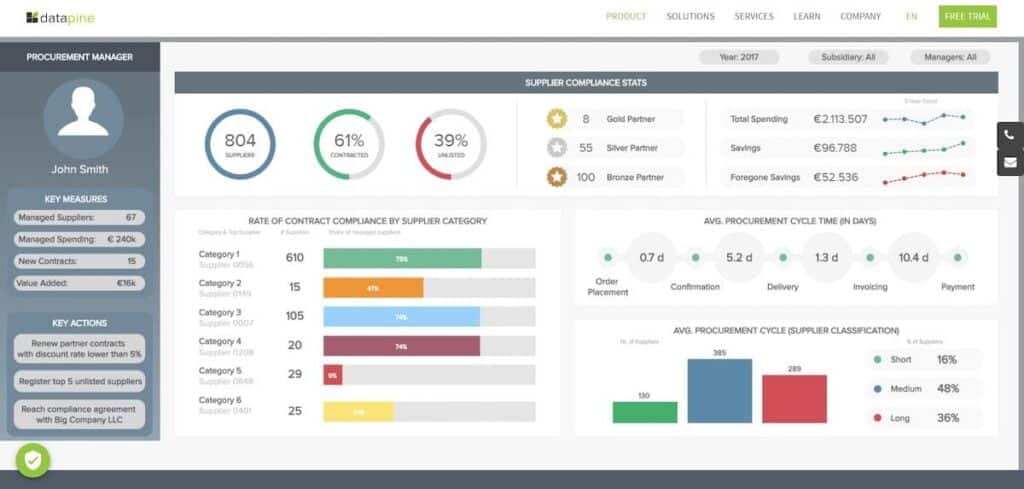
It is a modern BIP where the data remains at its safety, and it enables the user to create dashboards and insights for its performance metrics, easily. It was designed with a very friendly user interface that almost any team member would use it without further questions, which allows for information to be collected, analyzed, reported, and used for critical decision-making at every layer of the business. ?️
Datapine best features
- Choose a dashboard template that’s either generic and function-based (like Funnel), industry-specific (like Finance) or platform-based (like Kit ago) in order to create more targeted visuals.
- You can also use easy data connectors that allow you to gather data in another app without switching back and forth between tools.
- Predictive analytics tools mine data to create what-might-be type ‘simulations’ that let you plan for all contingencies.
- AI-based data alerts keep you on top of changes that can affect your business.
Datapine limitations
- The mobile dashboard design isn’t as interactive as the desktop version.
- There’s a learning curve to explore the full suite of features.
Datapine pricing
Free trial: 14 days Contact for pricingDatapine ratings and reviews
- G2: 4.6/5 (20+ reviews)
- Capterra: 4.9/5 (20+ reviews)
10. Sisense
 via Sisense
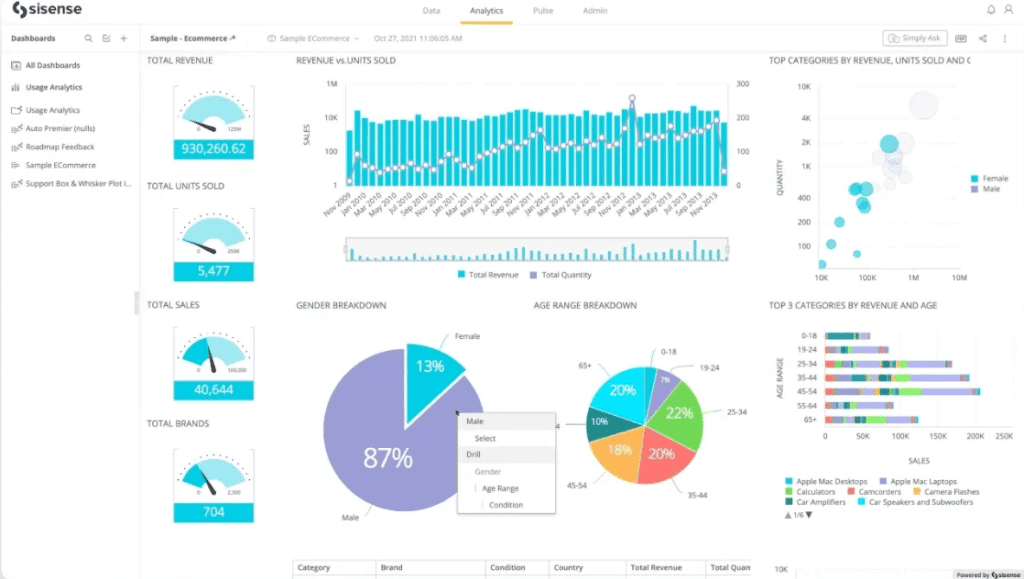
Sisense allows developers to embed data into customised products via APIs and SDKs, automated with built-in artificial intelligence and machine learning tools that drill down into the numbers to offer data-based insights. Then it allows you to share action items and key takeaways from your numbers using custom dashboards and other visualisations.
Sisense best features
- Visualise overwhelming amounts of data in interactive (drillable) charts — interlinked to KPIs and other meaningful metrics for users and for clients.
- AI-generated insights highlight trends, identify problem areas, and emphasize key successes.
- Alerts and predictions keep you ahead of potential issues and ready for innovation.
- With data connectors, you can determine what type of sources of data you want to bring together when reporting.
Sisense limitations
- Some users experienced bugs using widgets and connectors.
- A few to choose from but pricing might put off small teams.
Sisense pricing
Contact for customized solutionsSisense ratings and reviews
- G2: 4.3/5 (800+ reviews)
- Capterra: 4.5/5 (300+ reviews)
11. Looker Studio (formerly Google Data Studio)
 Via Looker Studio
Looker Studio is previously Google Data Studio, a tool with a steep learning curve, that creates more visually friendly and digestible reports. It allows you to bring data sets from all over the place into the same place to be converted directly into a readable report. As a bonus, Looker Studio is free to use. Through Looker Studio, we get to decide how we tell our ‘numbers’.You can do all of the following in Looker Studio:
- Use graphics, tables, or bar charts.
- Decide what type of numbers and data you want to share.
- Add text to explain data points or what’s displayed in the report.
- Change fonts and colors.
- Brand the report with your client’s logo.
- Add a video to explain something to your client.
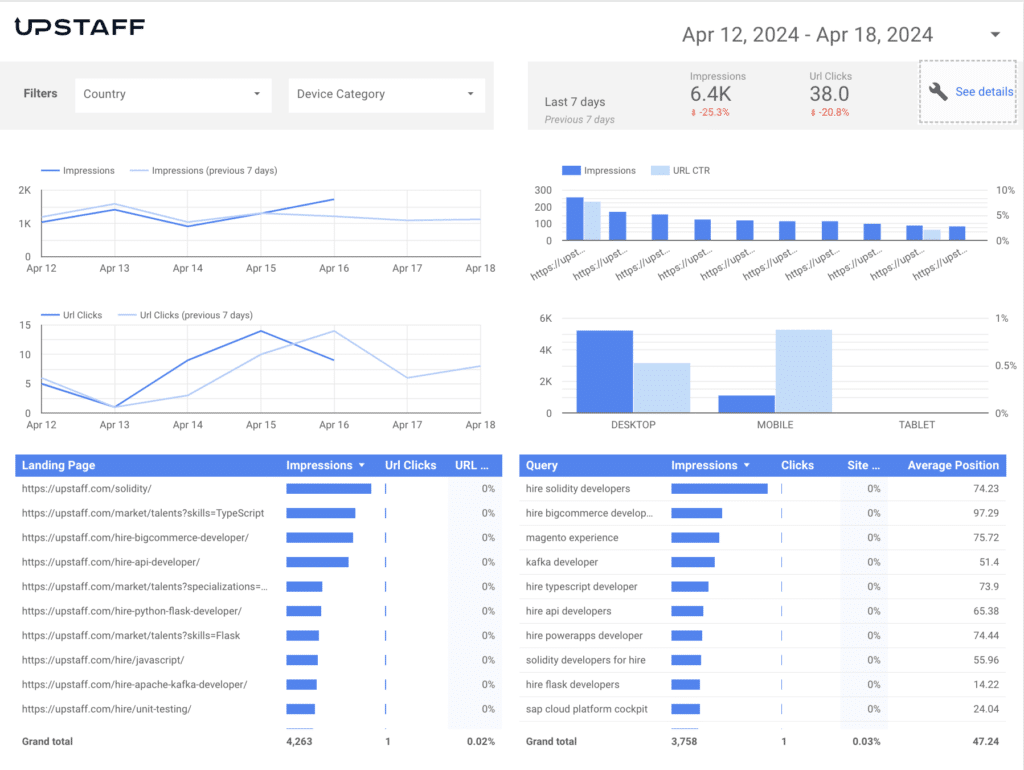
How to hire BI developer
If Fiverr, Upwork, other recruiting services and job boards are not your 1st option, you may want to consider a client-oriented service like Upstaff to find developers. Upstaff has a network of vetted and tested software engineers. Here you can hire Data Analyst and Business Intelligence (BI), Data Engineer, Data Extraction and ETL, Data Science, Data Visualization, Process Mining experts for a few simple tasks or a long-term responsible roles like founding engineers. With platforms and services like the ones mentioned herein, you finally have a reliable solution to your development chores and thus there is nothing to stop you from realizing your loftiest expectations meant to give impetus to your business fortunes. If you need talented software developers to create precise results, Upstaff is here for you. Visit our site to learn more about our development services and let’s make your project beat all competitors!
Table of Contents
- What is Business Intelligence Software?
- What Should You Look for in Business Intelligence Software?
- The 11 Best Business Intelligence Software to Use in 2025
- 1. SAP BusinessObjects Business Intelligence
- 2. Microsoft Power BI
- 3. Zoho Analytics
- 4. Tableau
- 5. Oracle Business Intelligence
- 6. Qlik Sense
- 7. Yellowfin BI
- 8. Dundas BI
- 9. Datapine
- 10. Sisense
- 11. Looker Studio (formerly Google Data Studio)
- How to hire BI developer
Popular
Popular
Recent
Talk to Our Expert
Our journey starts with a 30-min discovery call to explore your project challenges, technical needs and team diversity.

Yaroslav Kuntsevych
co-CEO