Want to hire D3.js developer?

What D3.js Developers can bring you:
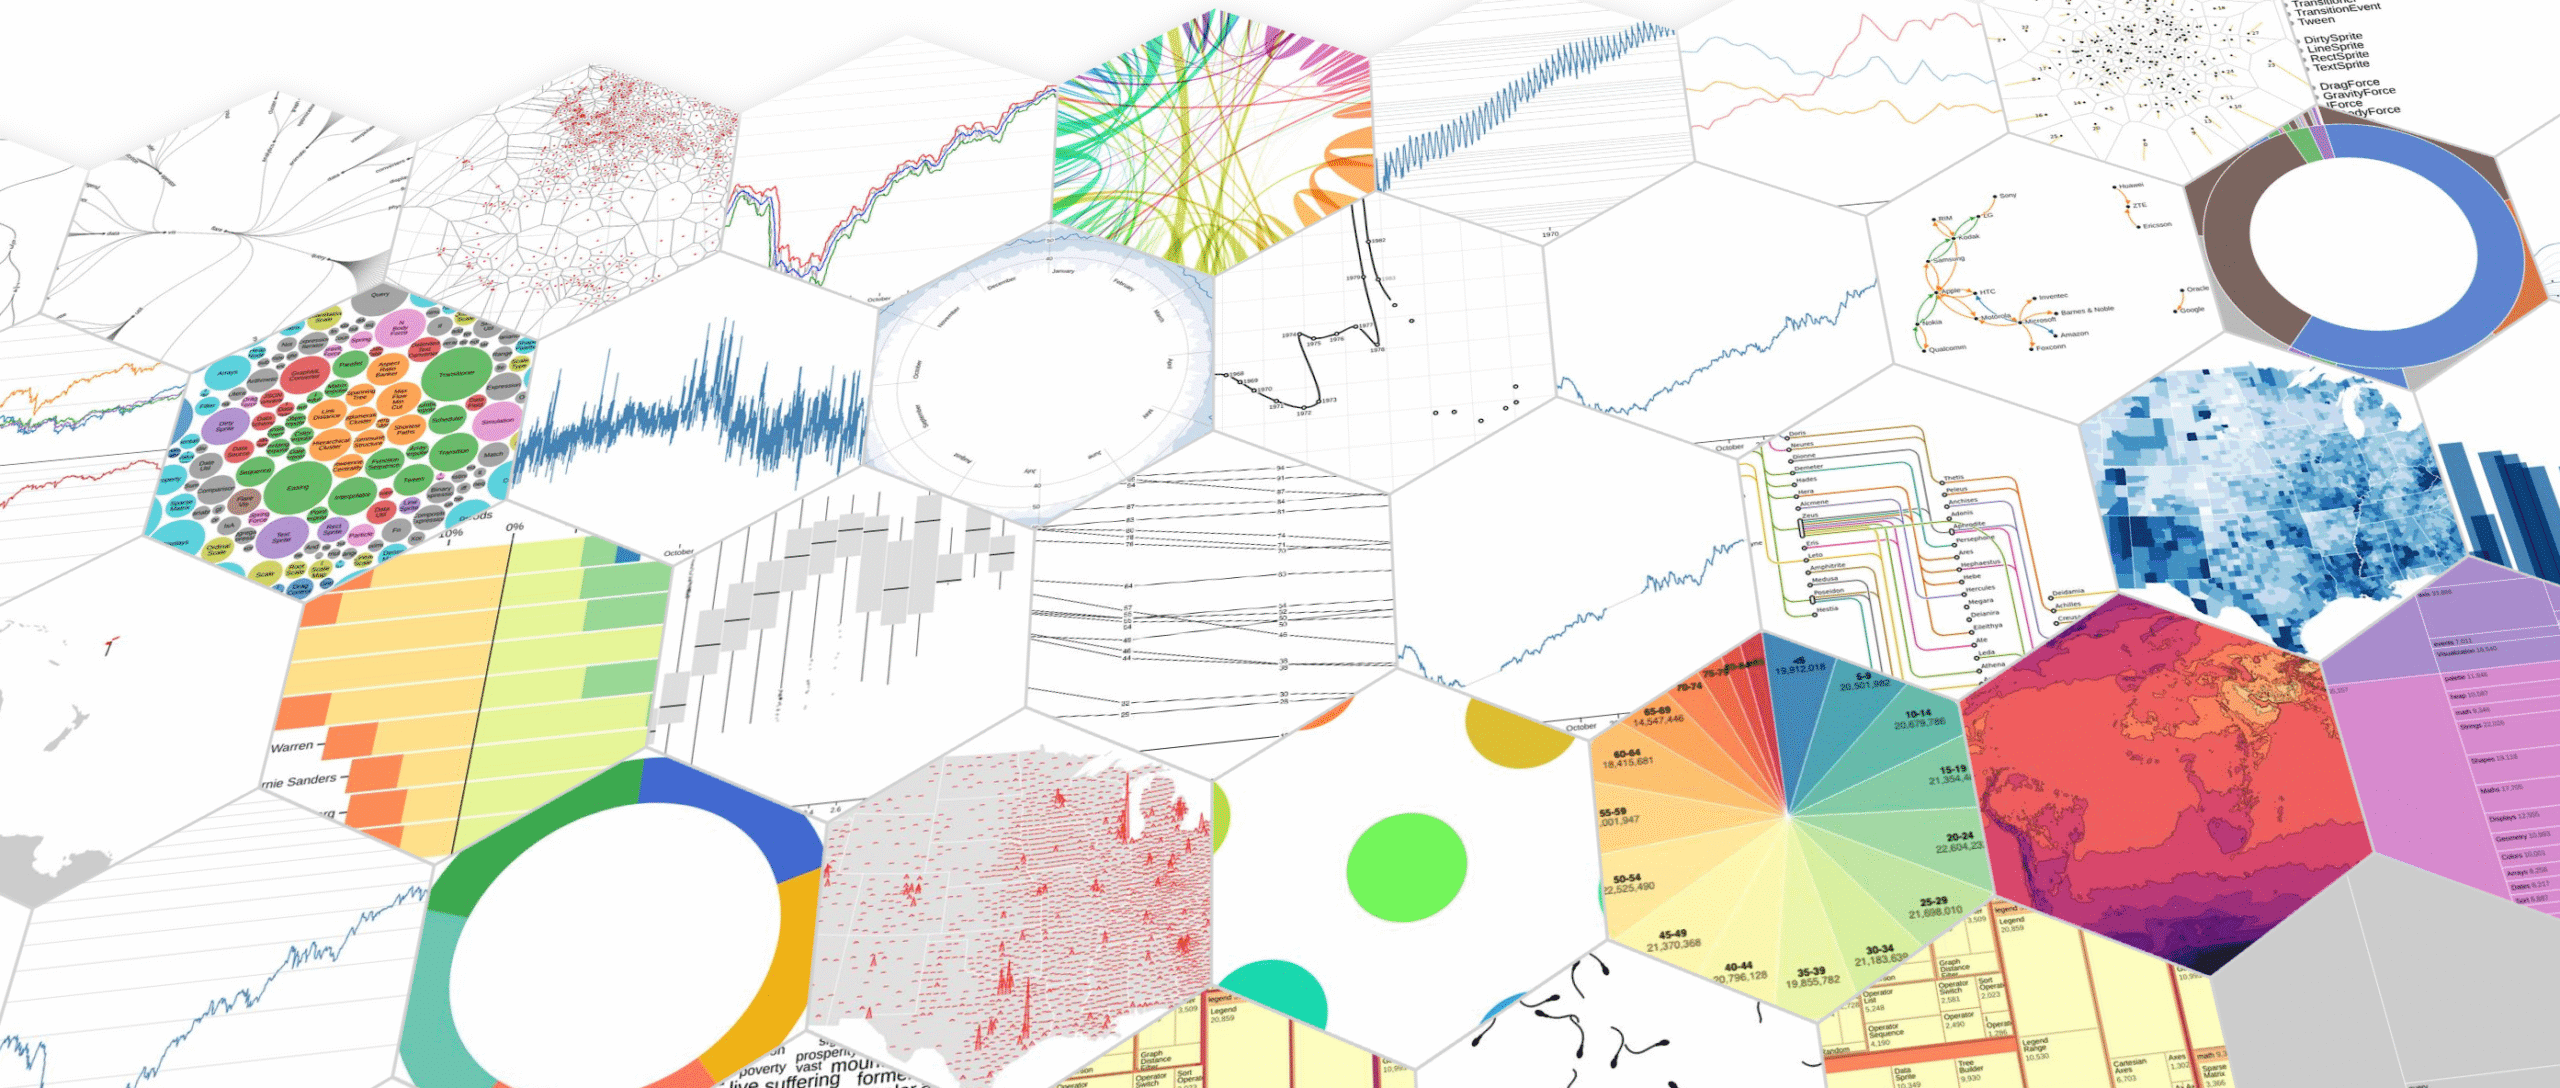
Interactive Data Visualizations: charts, graphs, and dashboards with dynamic user interaction.
Real-Time Dashboards: interfaces for continuous data monitoring and updates.
Geospatial Mapping: location-based visualizations using D3-Geo for spatial data analysis.
Network Graphs: complex entity relationships with clear, structured visuals.
Custom Data Widgets: specialized displays to meet specific business needs (product comparison, statistics, stakeholder dashboards)
Animated Transitions: smooth data transitions for enhanced user experience.
Data-Driven Art: Craft creative visualizations to present data in compelling formats.
Cross-Platform Integration: Integrate D3.js with React, Angular, Vue.js, or Node.js for cohesive web applications.
Technical Expertise:
Core Skills: JavaScript, TypeScript, HTML, CSS, SVG, and D3.js.
Visualization Tools: D3-Annotation, Crossfilter, D3FC, DC.js, D3-Geo, Chart.js, Highcharts, GoJS.
Related Technologies: React, Angular, Vue.js, Node.js, Next.js, Webpack for front-end development.
Data Management: API integration, handling large datasets, and performance optimization with MongoDB, PostgreSQL, AWS.
Development Practices: Agile, Scrum, and CI/CD using Git, Jenkins, Docker.
What is D3.js
D3 (or D3.js) is a free, open-source JavaScript library for visualizing data. Its low-level approach built on web standards offers unparalleled flexibility in authoring dynamic, data-driven graphics. For more than a decade D3 has powered and visualizations, become a building block of higher-level chart libraries, and fostered a vibrant community of data practitioners around the world.
D3 was created by Mike Bostock in 2011 (co-authored the D3 paper with Jeff Heer and Vadim Ogievetsky at Stanford). Over the years, many individuals have contributed to D3 by sharing code and ideas, by teaching and answering questions, and by bringing people together to further the practice of visualization. Mike and Philippe now maintain D3 and Observable Plot at Observable.
D3 doesn’t introduce a new graphical representation; instead, you use D3 directly with web standards such as SVG and Canvas.
Fun Fact: D3.js stands for Data-Driven Documents and is pronounced as “D-three.”.
How and where is D3.js used?
- Interactive Data Visualization: Showcasing dynamic data
- Real-time Dashboards: Displaying live updates
- Dynamic Charts and Graphs: Visualizing data trends
- Geospatial Mapping: Creating interactive maps
- Network Graphs: Illustrating relationships between entities
- Data Art: Transforming data into artistic visualizations
- Custom Data Widgets: Building personalized data displays
- Animated Data Transitions: Adding visual appeal to data changes
- Scientific Data Analysis: Assisting in complex data interpretations
- Collaborative Data Editing: Allowing multiple users to interact with data simultaneously
What are top D3.js instruments and tools?
Use this fantastic list of top-notch D3.js instruments and tools. Dive in and discover the wonders of web visualization!
- D3.js: The OG data visualization library.
- D3-Annotation: Add annotations to your visualizations.
- Crossfilter: Fast multidimensional filtering for coordinated views.
- D3FC: Collection of components for D3.
- DC.js: Dimensional charting built to work natively with crossfilter.
- D3-Geo: Geographic projections and other tools for maps.
Talk to Our Expert
Our journey starts with a 30-min discovery call to explore your project challenges, technical needs and team diversity.


